
Sign Up For Free Tips So You Can:
Why a smart comparison chart helps your customers say yes faster
Australian shoppers are famously price-aware, and many scroll through three or four tabs before committing. Whether they're comparing mobile plans in Brisbane, energy retailers in Adelaide, or subscription coffee boxes shipped from Melbourne to Perth, the buying journey almost always ends with a side-by-side glance. That is exactly why a well-built comparison chart works so well — it lets a hesitant buyer see the difference between their options without digging through every product page.
Done right, the chart becomes a quiet salesperson. It removes the cognitive load of comparing specs, which matters in a market where Afterpay and Zip have trained consumers to weigh monthly instalments as carefully as sticker prices. It also speeds up the decision, which is critical when attention spans are short.
For business owners, the chart does something else. It pulls the reader deeper into your funnel, often nudging them from "just browsing" to "ready to buy." When a chart clearly favours your offer, the prospect doesn't need a follow-up email to feel convinced — the page does the work for you.
Below, we'll walk through what makes a comparison chart genuinely useful, the layout choices that resonate with Australian buyers, and the small mistakes that quietly flatten conversion rates.
The real reason buyers stall before they click buy
A purchase almost never dies because the product is bad. More often, it dies because the buyer cannot tell whether option A is actually better than option B. The hesitation lives in their head, not on your website.
A simple side-by-side chart replaces that mental juggling act with a clear visual answer. Price, features, support, and warranty appear in one place, and the lift in clarity translates directly into lift in conversion. If you've ever sent nurture sequences to "warm" leads who never moved, chances are the message sequence was solid but the decision page left them stuck.
Anatomy of a chart that actually drives decisions
The strongest charts share three traits: a clear pricing headline, scannable feature rows, and a visible "recommended" call-out. Put the most important differentiator in the left column and price in the right, mirroring the way Aussies read a menu at a Melbourne brunch spot — price last, item first.
Other elements matter too, like social proof tucked under the recommended tier, a money-back reassurance that aligns with Australian Consumer Law guarantees, and a primary button colour that contrasts with the rest of the page. Skip jargon and keep rows short. Anything that needs two lines is probably a row you can split. A good rule is to cap the chart at six or seven rows — longer starts to feel like fine print, and Australian shoppers will scroll past it the way they skip a 40-page terms document.
Picking the right layout for the way Australians shop
A wide table works on desktop, but mobile readers in Sydney's commuter belt or on Brisbane's new metro platforms need a stacked card layout instead. Build responsive design from the start, and test both formats before publishing.
Colour carries weight too. Australian consumers respond to calm blues, clean whites, and the occasional warm accent, while heavy gradients and neon highlights feel overseas and erode trust. Pair your chart with confident typography and generous white space so the eye lands on price and features first. If you sell subscriptions, make sure monthly and annual pricing are clearly comparable, because many visitors will mentally divide the figure by their weekly budget rather than the yearly total.
Mistakes that quietly undermine your comparison
The biggest mistake is hiding your weakest side. Honest comparison builds trust, and trust is a quiet currency in the Australian market where word-of-mouth spreads fast through Facebook groups and local subreddits. If your chart only stacks five green ticks and one yellow dot, experienced shoppers will assume that row is the deal-breaker.
Another common slip is forgetting the post-chart moment. Once the buyer reaches the bottom, they need a single, obvious next step. Follow up with timing that lines up with when they actually open their inbox — fresh send windows shift by audience and time zone, so a generic Tuesday morning rarely wins anymore.
A third issue is rank-ordered vanity. Listing every feature you have, including niche ones only power users care about, dilutes the rows that actually drive a yes. Trim until only the decision-making rows remain.
Putting it all together with a simple template
A useful starting point is the three-tier structure you've already seen on most Australian SaaS landing pages: Basic, Standard, Premium. It mirrors the way many shoppers think — cheap for a starter, premium for heavy users, and a comfortable middle for everyone in between.
Keep the labels honest and the price gap proportional. A jump from $19 to $89 across two tiers feels aggressive for a local audience, while $19, $29, and $49 reads as a sensible ladder. Match the visual weight of each column to the buyer you most want to attract.
Before publishing, ask three friends from different states to read the chart for ten seconds and name the option they'd pick. If two of three land on the same tier, the chart is doing its job.
| Feature | Basic | Standard | Premium |
|---|---|---|---|
| Monthly price (AUD) | $19 | $49 | $89 |
| Active projects | 3 | 15 | Unlimited |
| Support level | Priority email | 24/7 chat | |
| Reporting cadence | Weekly | Daily | Real-time |
| Free trial | 14 days | 14 days | 30 days |
| Best fit | Solo makers | Growing teams | Agencies |
Notice how the recommended tier sits in the middle on purpose. Australian buyers often pick the middle option because the leap in price feels safer than jumping straight to the top tier, and the research in this analogies in marketing piece explains why a middle frame consistently lands trust. Once your chart is live, share the URL with subscribers and link to it from a fresh blog post. If you want a worked example, take a look at how a boutique hot sauce brand turned its tasting notes into a tidy comparison tool that nudges curious shoppers toward the medium-heat pack.
Want a deeper approach to positioning, offers, and persuasion? Pull the free ebook and email templates from the Marketing Cipher homepage, drop the chart URL into your welcome sequence, and let the page do most of the convincing from that moment on.
Expert Marketing Tips & Tricks
We will share with you the latest tips and tricks from proven marketing experts:
- Dominate your target market
- Write powerful sales copy that converts
- Learn traffic secrets to attract unlimited leads
- Create Irresistible offers
- Grow your email list
Get FREE Marketing Tips So You Can Grow Your Online Business
Check Out Our Latest Posts
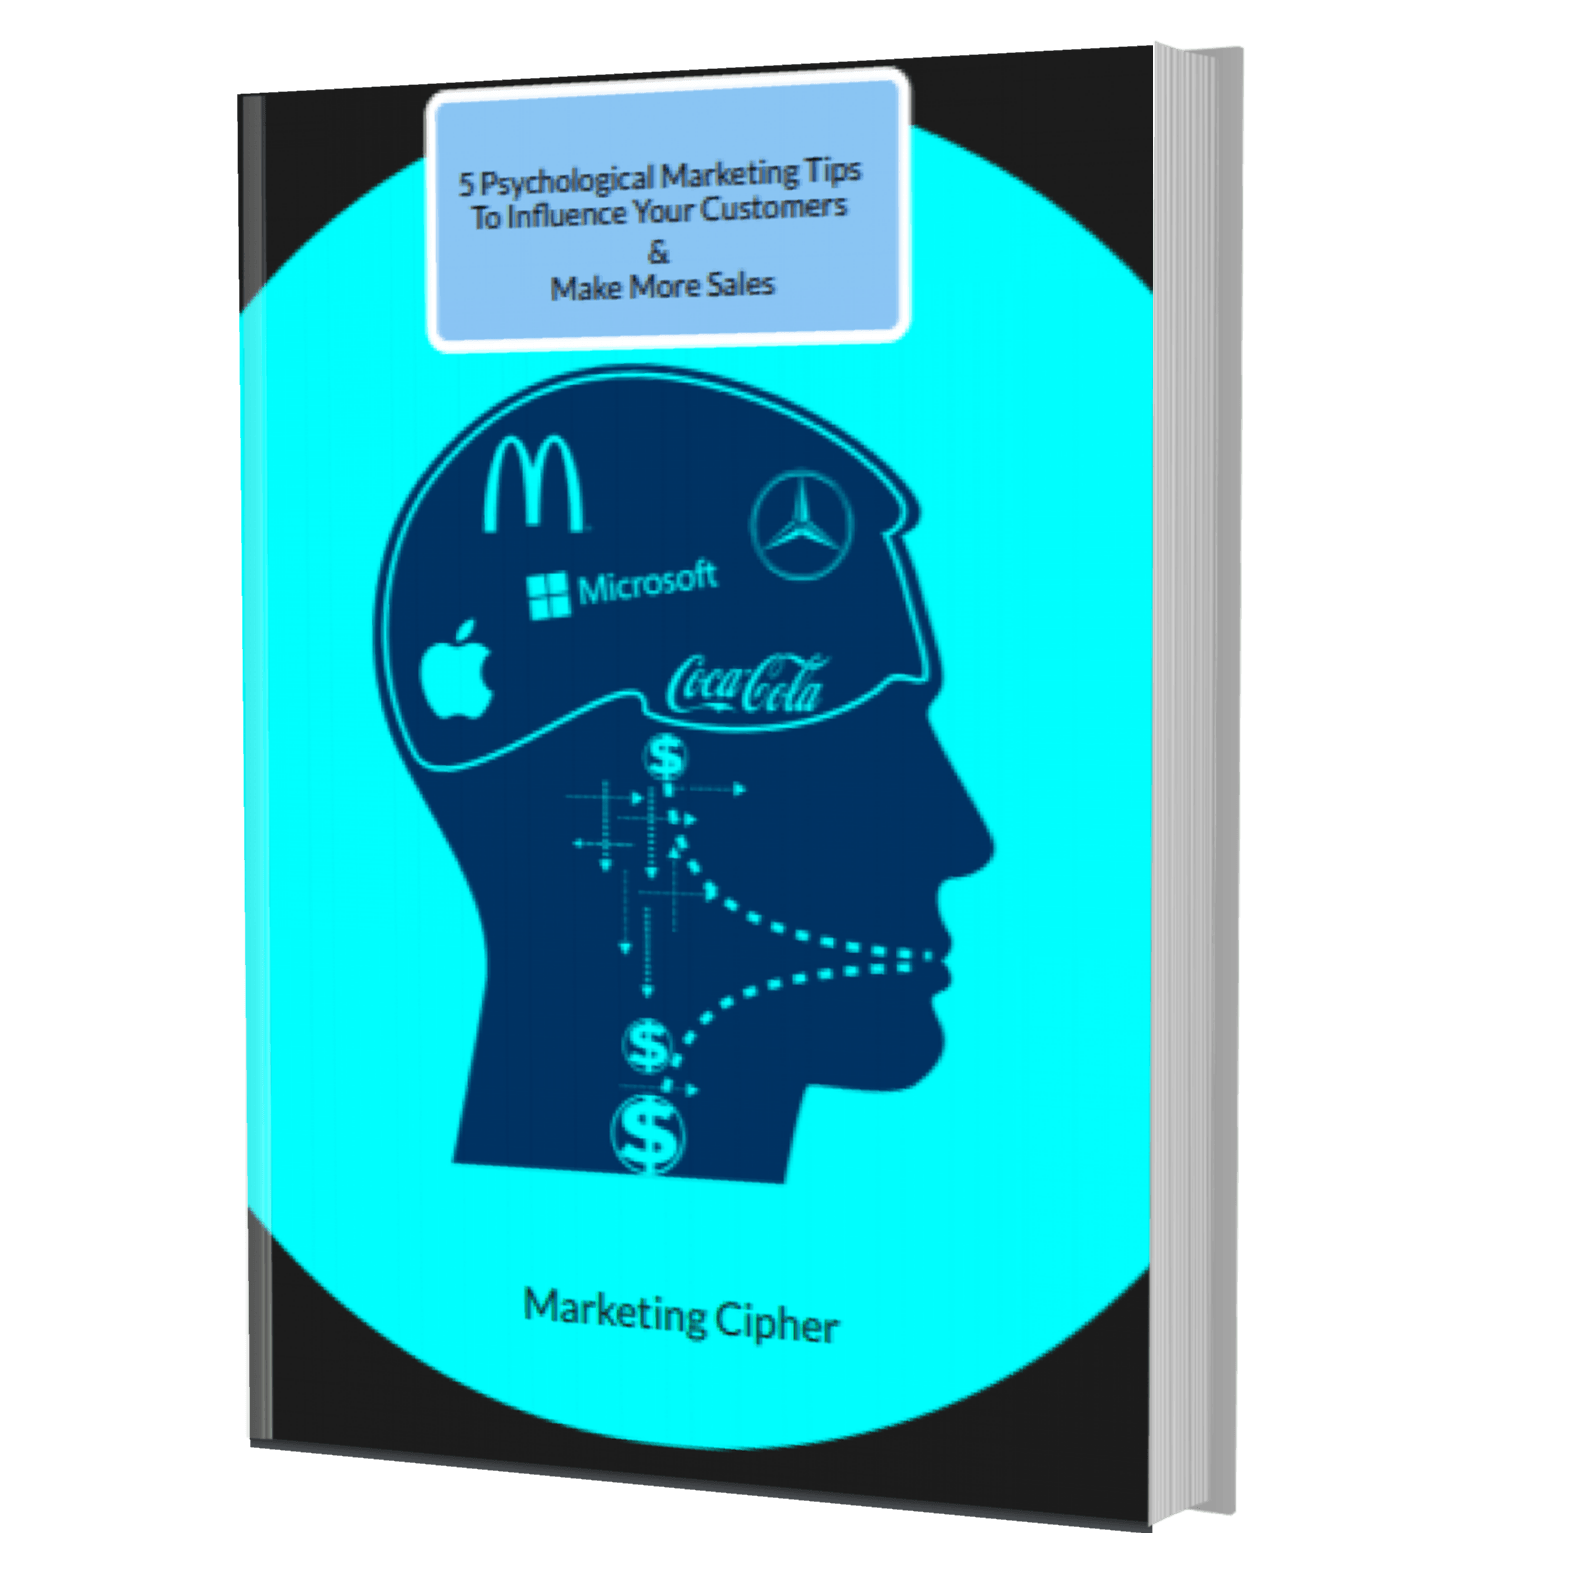
Get Your FREE Gift
"5 Psychological Marketing Tips To Influence Your Customers & Make More Sales"
Download This Free e-book To Learn How To:
Want More Leads, Traffic, & Sales?
Sign Up For Free Tips & Boost Your Results Now!